
Qualcomm (QCOM) - DeepDive.
From Smartphone Anchor to Edge to Cloud Compounder.

Company Name: Qualcomm Incorporated
Ticker: QCOM 0.00%↑
Exchange: NASDAQ
Reporting Currency: USD
Fiscal Year End: Late September (September 28, 2025, for FY25)
Country of Incorporation: Delaware, USA
Business Classification: Semiconductors, Fabless, plus IP Licensing
Research Date: July 10, 2026
Latest Filing Set: 10K FY25 (Nov 2025), 10Q Q2 FY26 (May 2026)
1. Executive Summary
Qualcomm is a fabless semiconductor and intellectual property licensing company headquartered in San Diego, California. The company operates two segments. QCT (Qualcomm CDMA Technologies) designs and sells chips for smartphones, automobiles, IoT devices, and increasingly data center servers. QTL (Qualcomm Technology Licensing) collects royalties on the global cellular device install base through a portfolio of approximately 140,000 patents covering 3G, 4G, and 5G standards. In fiscal 2025, QCT generated $38.4 billion at a 30% EBT margin, and QTL generated $5.6 billion at a 72% EBT margin. Total revenue was $44.3 billion, up 14% year over year.
The most important strengths are three. First, the QTL royalty annuity is a structural cash flow floor that persists regardless of who wins any individual chip socket. Even when Apple ships its own modem, Apple still pays QTL royalties on every iPhone. Second, the automotive pivot is no longer a thesis. It is a track record. Automotive revenue has grown for 23 consecutive quarters at double-digit rates, reaching $4.0 billion in FY25 and exiting FY26 at a $6 billion annualized run rate. The design win pipeline expanded from $6.5 billion in 2019 to $65 billion in 2026. Third, the financial engine is exceptional. Free cash flow was $12.8 billion in FY25, 100% of which was returned to shareholders, and the share count has been reduced 30% over 10 years.
The biggest risks are three. First, customer concentration. Apple, Samsung, and Xiaomi each represented 10% or more of FY25 revenue, and the top two customers combined accounted for 46% of Q2 FY26 revenue. Apple is in sourcing its own modem, which creates a structural headwind to QCT handset revenue beginning in the September 2026 quarter. Second, geography. China represented 46% of FY25 revenue ($20.3 billion), and U.S. export controls, plus the expired Huawei license, create ongoing uncertainty. Third, execution. The data center pivot targets $5 billion in FY27 and $15 billion in FY29, but Qualcomm has zero track record shipping data center silicon at scale, and the software stack (Modular acquisition) is unproven against Nvidia CUDA.
The overall verdict is that Qualcomm is a great business with a structural cash flow floor, a proven automotive growth engine, and a high upside data center option. The base case (auto plus QTL plus buybacks) justifies ownership on its own merits. The data center pivot represents free option value not currently priced into a smartphone company valuation framework. The DCF intrinsic value, projected strictly from management guidance, suggests significant upside if the FY29 targets are achieved, with downside protection from the QTL floor.
Whether this is a great long-term compounder: yes, with qualifications. The 9-year financial record shows revenue nearly doubling from $22.3B (FY17) to $44.3B (FY25), free cash flow tripling from $4.3B to $12.8B, and EPS growing from $1.64 to $9.20 (LTM). The share count has been reduced 30% over 10 years. The business is compounding per share value efficiently through a combination of earnings growth and aggressive buybacks. The qualification is that the next phase of compounding depends on the data center ramp, which is unproven.
2. Company History
Qualcomm was founded in 1985 by Irwin Jacobs, Andrew Viterbi, and five colleagues in San Diego, California. The founding technology was CDMA (Code Division Multiple Access), a method for letting many wireless devices share the same frequency band simultaneously using unique mathematical codes. CDMA became the foundational protocol for 3G, the architectural DNA of 4G LTE, and the basis of 5G. The company went public in 1991 and spent the 1990s building its patent portfolio and chip business around the CDMA standard it had created.
The major strategic shifts over the past decade define the current company. In 2017 through 2019, Qualcomm fought and settled a massive legal battle with Apple over licensing terms, with the April 2019 settlement including a multi-year chip supply agreement. In 2021, Cristiano Amon became CEO and launched the diversification strategy at the Investor Day that year, targeting automotive and IoT as the growth vectors beyond handsets. The Nuvia acquisition (2021, $1.4 billion) brought custom CPU technology that became the Oryon CPU. The Arriver acquisition (2022) brought ADAS software capability. In 2024 through 2026, the diversification accelerated: the Alphawave acquisition (closed Q1 FY26) brought data center connectivity IP, the Modular acquisition (announced June 2026) brought a CUDA alternative software stack, and the Arduino acquisition brought 33 million developers into the ecosystem.
The business evolved from a modem and patent licensing company focused on mobile phones into a diversified edge computing company spanning smartphones, automotive, IoT, PCs, robotics, and data centers. The 2026 Investor Day raised the non-handset FY29 revenue target from $22 billion (set in 2024) to $40 billion, with $15 billion from data centers alone. Management cited approximately $100 billion in cumulative R&D investment as the foundation of the current patent portfolio and technology position.
3. Business Model
3.1 What Qualcomm Sells
Qualcomm sells two things. First, physical silicon chips through the QCT segment. The flagship product line is Snapdragon, which is a System on Chip (SoC) that integrates a CPU, GPU, DSP, ISP, and modem onto a single piece of silicon. Snapdragon variants power smartphones (Snapdragon 8 Elite), PCs (Snapdragon X2 Elite), automobiles (Snapdragon Digital Chassis), and industrial devices (Dragonwing). The new Dragonfly platform targets data center inference. Second, intellectual property licenses through the QTL segment. QTL does not manufacture anything. It licenses Qualcomm's patent portfolio to any company that builds a cellular device, collecting a royalty (typically a percentage of device selling price) on every 3G, 4G, or 5G phone shipped globally.
3.2 Who the Customers Are
QCT customers are the companies that build devices: smartphone OEMs (Samsung, Xiaomi, Oppo, Vivo, Google, Motorola), automakers (BMW, Volkswagen, Mercedes, Toyota, GM, Hyundai, Stellantis, and Chinese EV makers), industrial companies (Honeywell, Dell, Lenovo, Palantir, and thousands of smaller IoT customers), and increasingly hyperscalers for data center custom silicon. QTL customers overlap significantly with QCT customers because any company shipping a cellular device must license Qualcomm patents, even if they use a competitor’s chip. Apple is both a QCT customer (modem purchases, declining) and a QTL customer (royalties, stable through 2027). MediaTek is a QTL licensee even though it is Qualcomm's primary competitor in phone chips.
3.3 How Qualcomm Makes Money
QCT makes money by selling chips at a gross margin of approximately 55% (FY25 gross profit $24.5B on $38.4B QCT revenue). The chips are designed by Qualcomm and manufactured by TSMC and Samsung Foundry under contract. QCT is a fabless, asset-light semiconductor business. QTL makes money by collecting royalties on the global device install base. QTL cost of revenue is minimal (approximately $1.5B in FY25, mostly legal and administrative), producing a 72% EBT margin. The royalty rate varies by customer and is governed by bilateral license agreements, some of which are public (the Apple 2019 settlement) and most of which are confidential.
3.4 Revenue Characteristics
QCT revenue is transactional and cyclical. It moves with handset unit volumes, memory prices, automotive production cycles, and consumer demand. QTL revenue is recurring and stable. It moves with global device sell-through (not sell-in), and is structurally protected by the patent portfolio. The 9-year data confirms this: QTL revenue has been remarkably stable at $5.3 to $5.6B from FY23 to FY25, while QCT revenue has swung from $30.4B (FY23) to $33.2B (FY24) to $38.4B (FY25). The blended business is approximately 87% transactional (QCT) and 13% recurring (QTL), though the QTL 13% punches far above its weight in earnings (QTL EBT of $4.0B vs QCT EBT of $11.7B in FY25).
3.5 Supply Chain and Key Dependencies
Qualcomm depends on TSMC and Samsung Foundry for chip manufacturing. The company disclosed at Investor Day 2026 that it consumes over 1 million leading node wafers annually and ships 40 billion components per year. This foundry dependency is the primary supply chain risk. On the demand side, the top three customers (Apple, Samsung, Xiaomi) represent over 40% of revenue, creating customer concentration risk. The business is asset-light: net property, plant and equipment was only $4.7B in FY25 on $44.3B in revenue, a ratio of 10.6%. This is the fabless model working as designed.
4. Industry and Strategic Position
4.1 Industry Classification
Qualcomm operates in the semiconductor industry, specifically the fabless wireless communications and computing segment. The business model combines two distinct economic engines: a hardware semiconductor business (QCT) and an intellectual property licensing business (QTL). This dual structure is unique among large semiconductor companies. No other major chip company (Nvidia, AMD, Intel, Broadcom, MediaTek) has a comparable patent licensing annuity that generates $5.6B annually at 72% margins on the global cellular install base.
4.2 Industry Tailwinds and Headwinds
The semiconductor industry is undergoing the largest structural shift in a decade: the AI compute buildout. This creates both tailwinds and headwinds for Qualcomm. The tailwind is that AI is moving from the cloud to the edge. Agentic AI workloads (AI that runs continuously in the background, fuses sensor data, and orchestrates multi-step tasks) require local processing for latency, privacy, and cost reasons. This drives demand for high-performance, low-power chips in phones, PCs, cars, and robots, which is exactly what Qualcomm designs. The Investor Day 2026 presentation cited a projection of a 40x increase in annual token demand between 2026 and 2030, with much of that demand served at the edge.
The headwind is that the AI data center buildout is consuming memory capacity. Memory suppliers (Samsung, SK Hynix, Micron) are redirecting DRAM production to HBM (High Bandwidth Memory) for AI accelerators. This has created a shortage of conventional DRAM for consumer electronics, particularly smartphones. Amon stated on the Q1 FY26 call that “the resulting industry-wide memory shortage and price increases are likely to define the overall scale of the handset industry through the fiscal year.” This is a near-term volume headwind on QCT handset revenue, though management expects it to bottom in Q3 FY26.
4.3 Strategic Position
Qualcomm's strategic position has three dimensions. First, in smartphones, Qualcomm is the leader in premium Android with an estimated 70%+ share at Samsung and a dominant position across Chinese flagships. The modem plus RF front-end integration is the deepest moat: Qualcomm is the only company that designs both the modem chip and the radio frequency components between the modem and the antenna as an integrated system. Second, in automotive, Qualcomm has gone from zero to a $6B run rate in 10 years and claims “there is not a modern vehicle that is built without the Snapdragon Digital Chassis.” The $65B design win pipeline represents contracted future revenue. Third, in the data center, Qualcomm is a new entrant with zero current revenue at scale but with two committed hyperscaler customers for custom silicon, a differentiated memory architecture, and the Modular software stack as a CUDA alternative.
The company positions itself as spanning “milliwatts to kilowatts,” from sub-2-milliwatt consumer devices to 200-kilowatt data center racks. This breadth is the strategic differentiator versus Nvidia (data center focused), MediaTek (handset focused), and Intel (PC and server focused). Whether this breadth translates to a durable competitive advantage in the data center remains the central question of the investment thesis.
5. Income Statement Analysis
5.1 Nine-Year Revenue and Profitability Trend
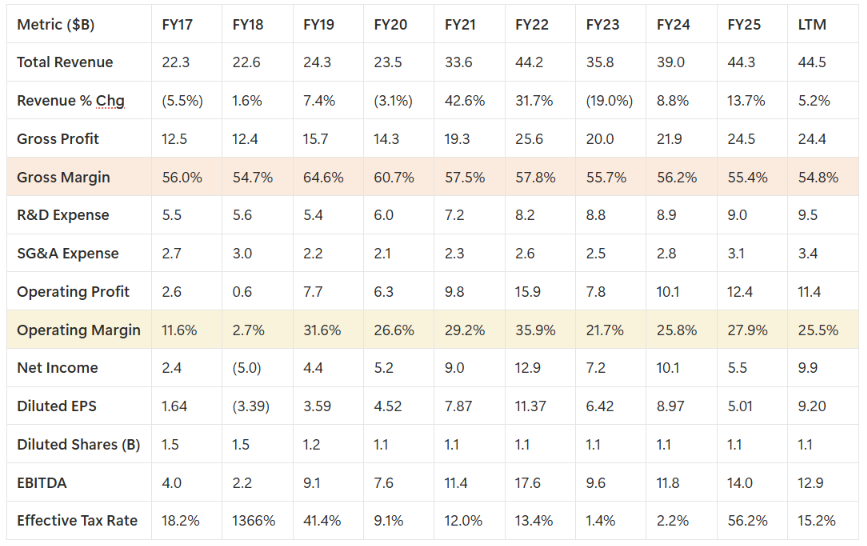
The table below presents the income statement summary for fiscal 2017 through the last twelve months, drawn from SEC filings. All figures are in billions of USD.
5.2 Revenue by Segment and End Market
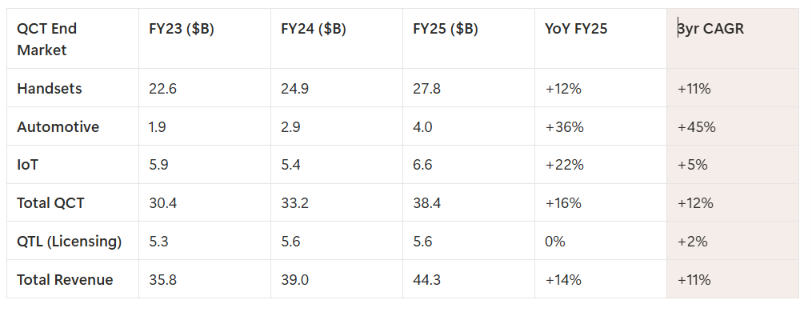
The FY25 10K (Note 8) breaks QCT revenue into three end markets. The table below shows the three-year trend:
5.3 Margin Trends: Expanding or Contracting?
Gross margin has been contracting modestly over the 9 years, from 56.0% (FY17) to 54.8% (LTM). This reflects a mix shift: automotive and IoT chips carry lower gross margins than premium handset Snapdragon chips, and as the mix diversifies away from handsets, blended gross margin compresses slightly. However, operating margin has expanded meaningfully from 11.6% (FY17) to 27.9% (FY25), driven by operating leverage: revenue grew 2x while R&D grew only 1.6x and SG&A was roughly flat. The Investor Day 2026 CFO deck targets QCT EBT margin at 30% long term and QTL at 70%, both of which were achieved in FY25 (QCT 30%, QTL 72%).
5.4 Growth Drivers: Price, Volume, Mix, or New Customers
The 10K MD&A attributes FY25 handset growth to “$2.5 billion in higher revenues per chipset, primarily driven by higher average selling prices and favourable mix, and $423 million in higher chipset shipments.” This is a price and mix story, not a volume story. Automotive growth is volume and mix: “higher automotive revenues, primarily driven by an increase in shipments from new vehicle launches with our Snapdragon digital cockpit products” plus the 8x content uplift from Gen 3 to Gen 5. IoT growth is volume: “$1.5 billion in higher shipments across edge networking, consumer and industrial products.” Data center growth (beginning FY27) will be entirely new customers: the two unnamed hyperscalers plus HUMAIN.
5.5 One-Time Items and Non-Cash Charges
Three items distort the headline numbers. First, FY18 net loss of $5.0B was driven by the Apple licensing dispute (which reduced QTL revenue) and a $2.0B NXP termination fee. This is non-recurring. Second, FY25 net income of $5.5B is depressed by a 56.2% effective tax rate, which includes discrete tax items. The LTM effective tax rate normalizes to 15.2%. Third, Q2 FY26 included a $5.7 billion non-cash GAAP tax benefit from the release of a previously recorded tax valuation allowance, triggered by new Treasury and IRS guidance on the corporate alternative minimum tax. This benefit is excluded from non-GAAP results. Share-based compensation was $2.8B in FY25 (6.3% of revenue), up from $0.9B in FY17. This is a real economic cost that the non-GAAP reconciliation adds back.
5.6 Share Count Dilution Trend
Diluted shares outstanding have declined from 1.5B (FY17) to 1.1B (FY25), a 27% reduction. This is the result of aggressive buybacks: $1.6B in FY17 growing to $9.9B in FY25. Over 10 years, management has retired 30% of shares. This is the primary mechanism by which EPS has grown faster than net income. In FY25, buybacks of $8.8B (56 million shares at $155.43 average) reduced the share count approximately 5%. The March 2026 announcement of a new $20.0B repurchase authorization provides approximately 2.5 to 3 years of buyback capacity at the current pace.
6. Balance Sheet Analysis
6.1 Nine-Year Balance Sheet Summary
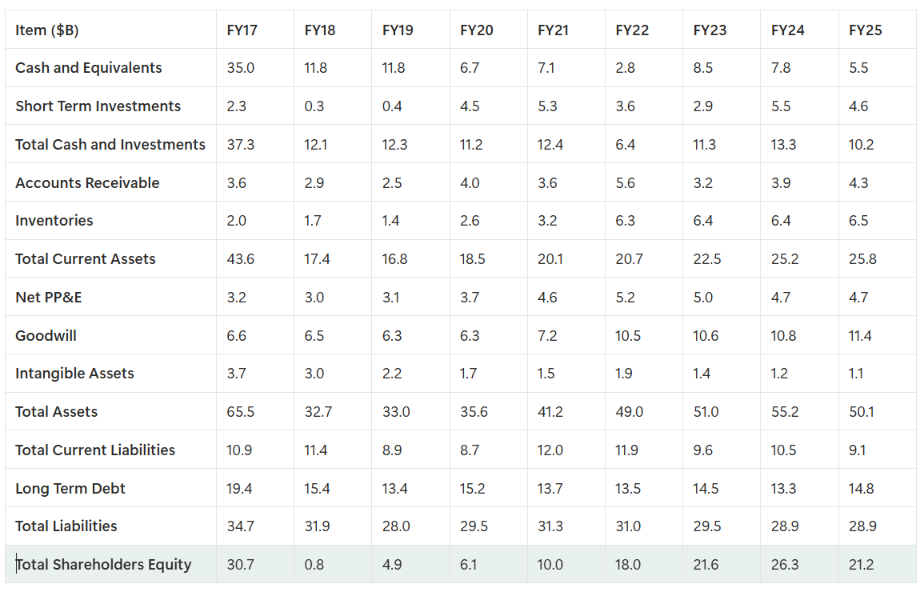
The table below presents the balance sheet summary for fiscal 2017 through fiscal 2025. All figures are in billions of USD.
6.2 Liquidity Assessment
Liquidity is strong. Total cash and short-term investments at FY25 year-end were $10.2 billion. The current ratio (current assets / current liabilities) was 2.8x ($25.8B / $9.1B). The company generated $14.0B in operating cash flow in FY25 and has a $20.0B buyback authorization (announced March 2026) plus a revolving credit facility (terms not disclosed in the provided source set). The Q2 FY26 10Q confirms that Qualcomm returned $3.7B to shareholders in the quarter ($2.8B buybacks plus $945M dividends) while simultaneously completing acquisitions (Alphawave, Augentix, Ventana Microsystems), indicating that liquidity comfortably covers both capital return and M&A.
6.3 Assessment
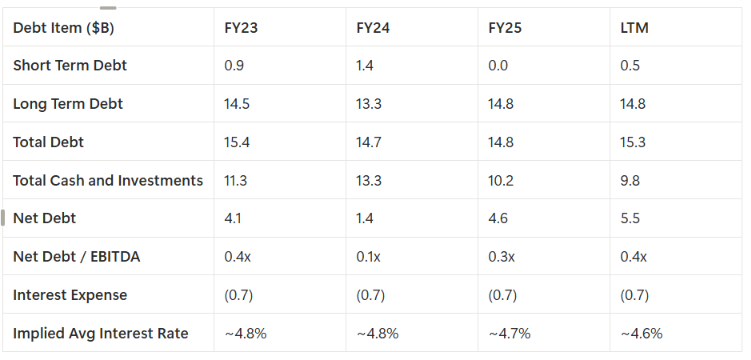
It is moderate and stable. Long-term debt was $14.8B at FY25 year-end, with no short-term debt disclosed. The debt to equity ratio is 0.70x ($14.8B / $21.2B). Net debt (total debt minus cash and investments) is $4.6B ($14.8B minus $10.2B), which is minimal relative to the $14.0B annual operating cash flow. The net debt to EBITDA ratio is approximately 0.3x ($4.6B / $14.0B FY25 EBITDA), well below the 2.0x threshold typically considered concerning. is not rising: long-term debt has been stable in the $13 to $15B range for 8 years, while cash and investments have fluctuated with capital return timing.
6.4 Goodwill and Intangible Assets: Impairment Risk
Goodwill was $11.4B at FY25 year-end (23% of total assets), up from $6.6B in FY17. The increase reflects acquisitions: Nuvia (2021, $1.4B), Arriver (2022), and the recent Alphawave, Augentix, Ventana, and Modular acquisitions. Intangible assets were $1.1B, declining from $3.7B in FY17 due to amortization. The impairment risk is real but manageable. If the data center pivot disappoints (for example, Qualcomm achieves only $3B of the $5B FY27 target), the goodwill allocated to the Alphawave and Modular acquisitions could face impairment testing. The 10K does not disclose the specific goodwill allocation by reporting unit, so a precise impairment risk assessment is not possible from the source set. The LTM goodwill figure of $14.3B (per the provided data) suggests the Alphawave acquisition added approximately $2.9B in goodwill, which would be the most at risk if the data center ramp disappoints.
6.5 Lease Obligations
Right-of-use assets and lease liabilities are not separately disclosed in the provided historical data. The 10K and 10Q would contain this information in the notes to financial statements, but specific lease amounts are not in the source set reviewed. Given that Qualcomm is a fabless semiconductor company (it does not own manufacturing facilities), lease obligations are likely limited to office and research facilities. Not disclosed in the provided source set.
7. Cash Flow Analysis
7.1 Nine-Year Cash Flow Summary
7.2 CFO vs Net Income: Are Earnings Backed by Cash?
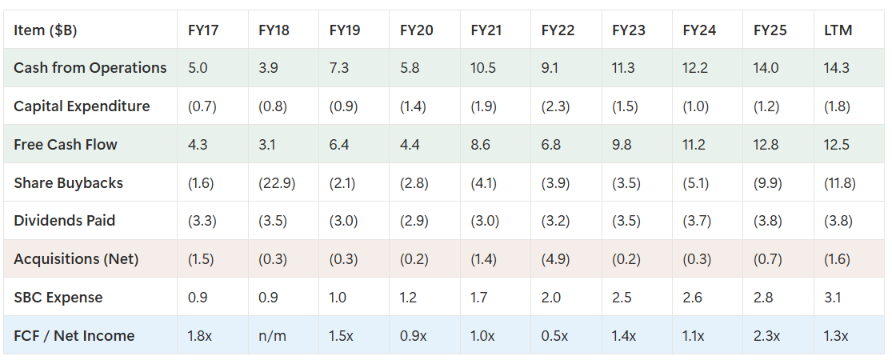
Yes, consistently. Over the 9 year period, cash from operations totaled $89.1B while cumulative net income was $61.7B. The FCF to Net Income ratio exceeded 1.0x in 7 of 9 years, meaning cash earnings consistently exceeded accounting earnings. The exceptions were FY22 (0.5x, when inventory built up $3.1B during the post COVID demand surge) and FY20 (0.9x, also inventory build). In FY25, the ratio was 2.3x because net income was depressed by the 56.2% tax rate while CFO was unaffected ($14.0B). This confirms that accounting earnings are high quality and backed by real cash.
7.3 Free Cash Flow Growth
Free cash flow has grown from $4.3B (FY17) to $12.8B (FY25), a 3x increase over 8 years, representing a 14.5% CAGR. The growth has been driven by three factors: (1) revenue growth from $22.3B to $44.3B (7.9% CAGR), (2) operating margin expansion from 11.6% to 27.9% (operating as R&D and SG&A grew slower than revenue), and (3) flat capex in absolute dollars ($0.7B to $1.2B, well below the revenue growth rate). The LTM FCF of $12.5B is slightly below FY25 due to the memory shortage impact on Q2 FY26 handset revenue, but management expects recovery beginning Q4 FY26.
7.4 Capital Intensity
This is a capital-light business. Capex as a percentage of revenue averaged 3.1% over the last 3 years ($3.7B cumulative capex on $118.6B cumulative revenue). The 9-year average is approximately 4.0%. This is the fabless model: Qualcomm designs chips but does not own fabs. Compared to Intel (20 to 25% of revenue in capex during its foundry buildout) or TSMC (40%+ of revenue in capex). The low capital intensity is the structural reason free cash flow conversion is so high. Every dollar of operating cash flow drops almost entirely to free cash flow.
7.5 Capital Allocation: Is Management Using Cash Wisely?
Yes, decisively. The 9 year data shows cumulative capital returns of approximately $80B ($50B in buybacks plus $30B in dividends), against cumulative free cash flow of approximately $80B. Management has returned approximately 100% of FCF to shareholders in both FY25 and FY26 (per Akash at the AGM). The buyback pace has accelerated: from $1.6B (FY17) to $9.9B (FY25) to an annualized $11.8B (LTM). The share count has been reduced 30% over 10 years. Acquisitions ($14.6B cumulative over 9 years) have been strategic, not financial engineering: Nuvia for CPU, Arriver for ADAS, Alphawave for data center connectivity, Modular for software stack, Arduino for developers. The capital allocation framework is textbook owner behaviour.
8. Working Capital and Operating Cycle
8.1 Working Capital Components (FY25)
8.2 Working Capital Efficiency
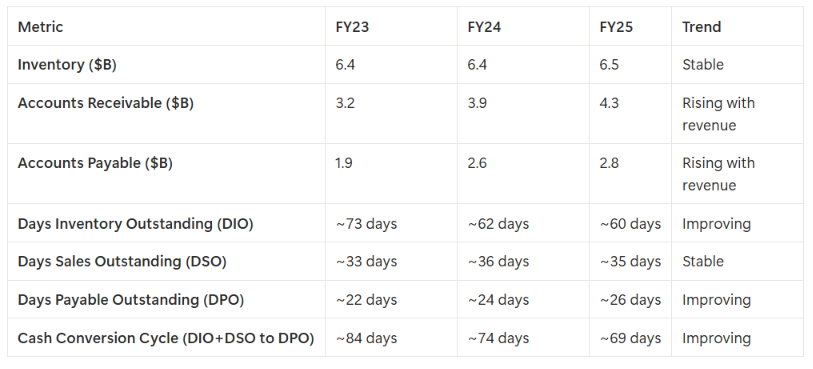
The working capital profile is a strength, not a drag. The cash conversion cycle has improved from approximately 84 days (FY23) to approximately 69 days (FY25), a 15-day improvement. This is driven by two factors: (1) inventory days have declined from 73 to 60 as the post-COVID inventory build normalized, and (2) payable days have extended from 22 to 26 as Qualcomm uses its scale to negotiate better supplier terms. Receivable days are stable at 35, consistent with the customer concentration (large OEMs pay on predictable schedules).
8.3 Inventory Assessment
Inventory is normalizing, not building. The FY22 inventory peak of $6.3B (during the post-COVID demand surge and supply chain scrambling) has been worked down to $6.5B in FY25, but on a revenue base that grew from $44.2B to $44.3B. The LTM inventory of $7.4B (per the provided data) reflects the memory shortage dynamics: Chinese OEMs are drawing down their own channel inventory, and Qualcomm is building some finished goods inventory to manage the supply disruption. Management expects Q3 FY26 to be the bottom for China Android revenue, with sequential growth resuming in Q4 FY26.
8.4 Customer Payment Behaviour
Customers are paying on stable schedules. DSO of 35 days is consistent with the large OEM customer base (Apple, Samsung, Xiaomi) that pays on standard net 30 to 45 day terms. The QTL licensing business collects royalties in arrears based on device sales through, which gives Qualcomm real-time visibility into end demand (Amon cited this on the Q2 FY26 call: “because of our licensing business, we do have visibility of what happens in the market, so we know sell through”). There is no indication of payment delays or receivable quality deterioration in the source set.
9. Debt, Leases, and Liquidity
9.1 Debt Profile
9.2 Debt Maturity Schedule
The specific debt maturity schedule (by year and instrument) is not disclosed in the provided source set. The 10K would contain this in the notes to financial statements (typically in the Borrowings note). What can be inferred from the 9-year data: long-term debt has been stable in the $13 to $15B range, with no apparent refinancing crisis. The company has issued and repaid debt opportunistically (FY18 long-term debt issuance of $11B for the accelerated buyback, FY17 repayment of $5.5B). The implied average interest rate of 4.7% is reasonable for investment-grade corporate debt. Not disclosed: specific maturity dates, covenants, and credit facility terms.
9.3 Liquidity Assessment
Liquidity is comfortable. Total liquidity sources at FY25 year end: $10.2B in cash and investments, plus an operating cash flow of $14.0B annual run rate, plus an undrawn revolving credit facility (size not disclosed). Total liquidity uses: $3.8B annual dividends, $8 to $12B annual buybacks (variable), and $1.2B annual capex. Even at the maximum capital return pace, liquidity comfortably covers all obligations with significant headroom for acquisitions. The AGM (March 2026) confirmed that Qualcomm “returned approximately 100% of free cash flow in fiscal 2025” and is “on track to do that in fiscal 2026 as well,” which is only possible if liquidity is abundant. No solvency or refinancing risk is evident.
9.4 Lease Obligations
Not disclosed in the provided source set. As a fabless semiconductor company, Qualcomm's lease obligations are likely limited to office and research facilities and should not be material relative to the $50.1B total asset base. The 10K notes to financial statements would contain the full lease disclosure.
10. Capital Efficiency
10.1 ROIC Calculation with Formula
Return on Invested Capital (ROIC) measures how efficiently a company generates after-tax operating profit from the capital invested in the business. The formula is:
ROIC = NOPAT / Invested Capital
Where: NOPAT = Operating Income times (1 minus Normalized Tax Rate)
And: Invested Capital = Total Debt plus Book Equity minus Cash and Short Term InvestmentsUsing FY25 figures from the 10K:
NOPAT (FY25, normalized) = $12.4B times (1 minus 0.18) = $12.4B times 0.82 = $10.2B
Invested Capital (FY25) = $14.8B (LT Debt) plus $0.0B (ST Debt) plus $21.2B (Equity) minus $10.2B (Cash and Investments) = $25.8B
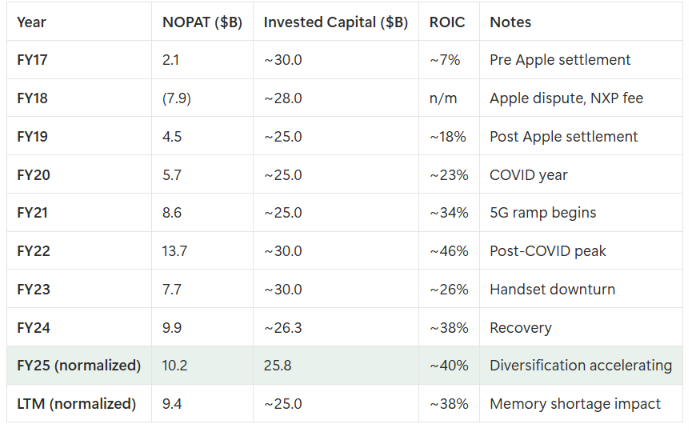
ROIC (FY25, normalized) = $10.2B / $25.8B = 39.5%Note: The FY25 reported NOPAT of $5.4B (per the provided data) uses the actual 56.2% effective tax rate, which is distorted by discrete tax items. Using a normalized 18% tax rate (the 9 year average excluding FY18 and FY25 distortions), NOPAT is $10.2B and ROIC is 39.5%. This is an exceptional return that reflects the capital light fabless model and the QTL royalty annuity, which generates $4.0B EBT on essentially zero invested capital.
10.2 Historical ROIC Trend
10.3 ROIIC: Return on Incremental Invested Capital
ROIIC measures the return on the incremental capital deployed in the most recent period. The formula is:
ROIIC = Change in NOPAT / Change in Invested Capital
Using FY25 vs FY24 (normalized):
Change in NOPAT = $10.2B (FY25 norm) minus $8.6B (FY24 norm at 15% tax) = $1.6B
Change in Invested Capital = $25.8B (FY25) minus $26.3B (FY24) = ($0.5B)
ROIIC = $1.6B / ($0.5B) = negative
The negative ROIIC is actually a positive signal. Invested capital decreased (because Qualcomm returned cash to shareholders via buybacks and dividends, reducing equity) while NOPAT increased. This means the business grew earnings without requiring additional capital, which is the signature of a capital efficient compounder. When invested capital shrinks, ROIIC becomes mathematically negative or undefined, but the economic reality is that the business is self funding its growth and returning excess capital. The appropriate interpretation is that Qualcomm does not need incremental capital to grow, which is a hallmark of a great business.
10.4 Is Qualcomm Compounding Value Efficiently?
Yes. The evidence is threefold. First, ROIC has averaged approximately 30% over the last 5 years (excluding FY18), well above the cost of capital (estimated at 9 to 10%, see Section 15). This means every dollar invested generates approximately $0.30 of after-tax operating profit per year. Second, the business grows without requiring incremental capital, as demonstrated by the negative change in invested capital in FY25. Third, the per-share metrics confirm efficient compounding: EPS grew from $1.64 (FY17) to $9.20 (LTM), a 5.6x increase, while revenue grew only 2x and net income grew 4x. The difference is the 30% share count reduction. This is the mathematical signature of a business that compounds per share value faster than it grows revenue, driven by high ROIC plus aggressive buybacks.
11. Moat and Competition
11.1 Moat Types Identified
Intellectual Property (Structural, perpetual): The QTL portfolio of approximately 140,000 patents and patent applications covering 3G, 4G, and 5G standards. Every compliant device shipped globally owes a royalty, regardless of whose chip is inside. This is the deepest moat in mobile semiconductors. The moat is supported by the QTL EBT margin of 72% and the revenue stability ($5.3 to $5.6B over 3 years through handset cycles).
Ecosystem and Integration (Durable, technical): Modem plus RF front-end integration. Qualcomm designs both the cellular modem and the radio frequency components between the modem and the antenna as a single integrated system. No competitor (MediaTek, Samsung LSI, Apple) matches this integration depth. The moat is supported by the QCT EBT margin of 30%, which is high for a hardware business, and by the Samsung 70%+ share framework.
Switching Costs (Automotive, contractual): Automotive design wins are contractual and last the life of a vehicle platform (typically 5 to 7 years). The $65B pipeline represents committed future revenue. Once a Snapdragon Digital Chassis is designed into a vehicle, switching costs to a competitor are prohibitive (re-certification of safety, re-validation of software, re-tooling of manufacturing). The moat is supported by 23 consecutive quarters of double-digit auto growth and the 8x content uplift from Gen 3 to Gen 5.
Scale and R&D (Compounding): Approximately $100 billion cumulative R&D investment (per Amon at Investor Day 2026). R&D expense of $9.0B in FY25 exceeds the total revenue of many mid-cap semiconductor companies. The scale advantage in modern engineering is difficult to replicate. The moat is supported by the 9-year operating margin expansion from 11.6% to 27.9%.
Developer Ecosystem (Emerging, unproven): The new moat being built: Arduino (33M developers), Modular (CUDA alternative software stack), Hugging Face partnership (16M AI builders). If successful, this becomes a network effect moat. This is currently aspirational, not durable, and depends on the Modular software stack achieving meaningful adoption.
11.2 Moat Durability Over 5, 10, and 20 Years
The QTL patent moat is the most durable, persisting as long as cellular standards remain in use (5G has a 10+ year runway, 6G is being positioned as the next transition, and Qualcomm patents encumber both). Over 20 years, the QTL moat has been structurally protected. The modem and RF integration moat is durable for 5 to 10 years, but is being eroded at the margins by Apple in house modem (C1 shipped, future generations coming) and MediaTek's improving flagship Dimensity line. The automotive moat is durable for 7 to 10 years (vehicle design cycle length) and is widening as content per vehicle uplifts 8x. The developer ecosystem moat (Arduino, Modular, Hugging Face) is the wildcard: if Modular succeeds as a CUDA alternative, this becomes a 10+ year moat in data center; if it fails, Qualcomm remains a hardware company competing on silicon specs alone.
11.3 Competition: QCOM vs MediaTek (Handsets)
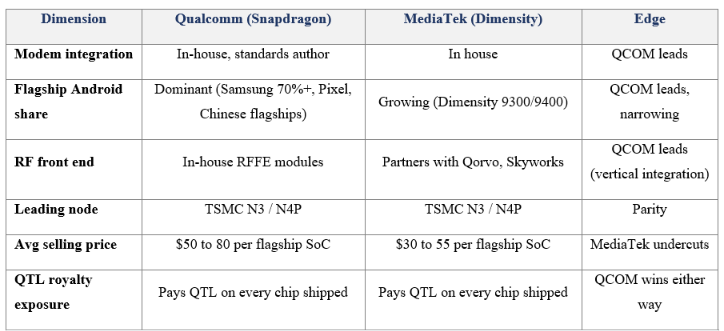
Qualcomm is the leader in premium Android, with the moat being modem plus RFFE integration. MediaTek is gaining share in mid-flagship (Dimensity 9300/9400 is genuinely competitive on benchmarks), but cannot match the integration depth. The structural kicker: MediaTek is itself a QTL licensee, so even when MediaTek wins a chip socket, Qualcomm still collects a royalty. Qualcomm is not losing share in the premium tier; MediaTek gains are primarily in the mid tier, where Qualcomm chooses not to compete aggressively.
11.4 Competition: QCOM vs Nvidia (Edge, Robotics, Data Center)
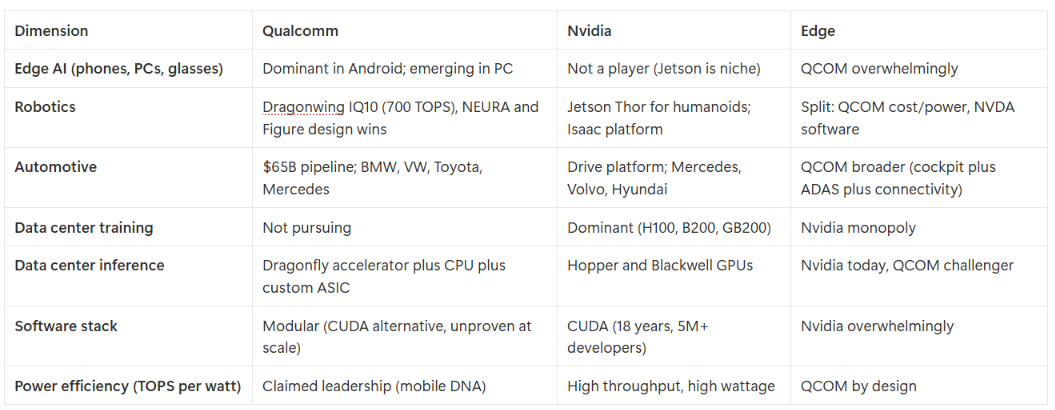
Qualcomm is the leader in edge AI and automotive. NVIDIA is the leader in data center training and AI software. The battleground is data center inference, where Qualcomm is the challenger. The CUDA software gap is the decisive variable: if Modular succeeds as a CUDA alternative, Qualcomm silicon advantages (memory architecture, power efficiency, CPU performance) become commercially relevant. If Modular fails, Qualcomm remains a hardware company fighting Nvidia on silicon specs alone, which is a weaker position. The moat against Nvidia is structural in edge and automotive (Qualcomm wins on integration and power), but temporary in data center (depends on software ecosystem development).
12. Management, Capital Allocation, and Governance
12.1 Key Executives
Cristiano Amon, President and CEO: Became CEO June 30, 2021 (the June 24, 2026 Investor Day marked his 5-year anniversary). Joined Qualcomm as an engineer approximately 30 years ago. Architect of the diversification strategy. Tone is bullish but backed by delivery: the 2021 Investor Day targets have been met or exceeded, with the $22B non handset 2029 target raised to $40B at the 2026 Investor Day.
Akash Palkhiwala, EVP, CFO and COO: Oversees finance and operations. Communicates the capital allocation framework clearly and consistently: 100% of FCF returned to shareholders, low single-digit dividend growth, opportunistic buybacks, disciplined M&A. The framework has been executed without deviation for multiple years.
Alex Rogers, EVP and President of QTL and Global Affairs: Oversees the licensing business and geopolitical/legal matters. QTL stability under his tenure ($5.3 to $5.6B over 3 years through handset cycles) is a key contributor to the cash flow floor.
Tony Pialis, GM of Data Center (new): Joined Qualcomm through the Alphawave acquisition. Leads the Dragonfly data center platform. His Investor Day 2026 presentation was the first public disclosure of the full data center roadmap. Track record at Alphawave and prior ventures provides credibility, though the Qualcomm data center business is unproven at scale.
12.2 Board Composition and Governance
The AGM March 17, 2026 transcript identifies the board nominees: Sylvia Acevedo, Mark Fields, Jeff Henderson, Zico Kolter, Ann Livermore, Jamie Miller, Marie Myers, Irene Rosenfeld, Jean Pascal Tricoire, plus Amon and McLaughlin. Two directors (Neil Smit, Chris Young) departed at the 2026 AGM. The board appears independent (majority non-management directors). No dual class share structure is disclosed. A stockholder proposal critical of Qualcomm's poison pill provision (25% threshold for special meetings versus the more common 10%) was voted down at the AGM, but its existence indicates some governance tension. Insider ownership and insider trading data: not disclosed in the provided source set.
12.3 Capital Allocation History
The 9-year capital allocation record is disciplined and owner-oriented:
Capital return: $80B cumulative returned to shareholders over 9 years ($50B buybacks plus $30B dividends)
Share count reduction: 30% of shares retired over 10 years (from 1.5B to 1.1B diluted shares)
Acquisitions: $14.6B cumulative over 9 years, all strategic (Nuvia, Arriver, Alphawave, Modular, Arduino, etc.)
R&D investment: $100B cumulative (per Amon), with R&D as % of revenue declining from 24.6% (FY23) to 20.4% (FY25) through operating leverage
Dividend policy: Low single-digit annual increases ($0.03 increase announced March 2026), consistent and sustainable
Debt management: Net debt of $4.6B against $14.0B annual CFO, no refinancing risk
12.4 Does Management Act Like Owners?
Yes. The evidence is the 30% share count reduction over 10 years, the 100% FCF return policy, and the disciplined M&A approach (35 acquisitions in 5 years, all strategic). There is no evidence of empire building, no evidence of debt-fueled financial engineering, and no evidence of M&A indiscipline. The communication is clear: Akash provides explicit guidance, ranges and explains variances. Amon is promotional but delivers on targets. The main risk is that the data center pivot (the largest capital deployment in company history, including the Alphawave and Modular acquisitions) is unproven, and if it fails, the goodwill on those acquisitions ($2.9B+ from Alphawave alone) could face impairment.
12.5 Red Flags
Two items, neither fatal. First, the AGM stockholder proposal on the poison pill (25% special meeting threshold) indicates some governance tension, though the proposal was voted down. Second, the Q2 FY26 GAAP results are inflated by the $5.7B non cash tax benefit from the CAMT valuation allowance release. This is legitimate accounting, not earnings management, but an investor comparing GAAP net income year over year must strip out the benefit. The non-GAAP EPS of $2.65 is clean. No other accounting quality red flags are evident in the source set. No legal, criminal, regulatory, or ethical issues are disclosed beyond the standard Risk Factors (ARM litigation, China export controls, customer concentration).
13. Risks, Accounting Quality, and Future Plans
13.1 Risk Factors (from 10K and 10Q)
Customer concentration:Apple, Samsung, and Xiaomi each represented 10%+ of FY25 revenue. Top two customers combined = 46% of Q2 FY26 revenue. Apple's modem in sourcing begins in the September 2026 quarter. Samsung dual sources with Exynos. Xiaomi is developing in-house Surge silicon.
Geography concentration: China = 46% of FY25 revenue ($20.3B). U.S. export controls to Huawei active (May 2024 revocation of 4G export license). Huawei QTL license expired Q2 FY25, renegotiation ongoing. Chinese OEMs developing domestic alternatives (SMIC fabricated Kirin, Xiaomi Surge).
Technology and competitive risk: Data center pivot targets $5B (FY27) and $15B (FY29) but Qualcomm has zero track record shipping data center silicon at scale. CUDA software ecosystem (Nvidia) is 18 years entrenched. Modular acquisition is unproven as a CUDA alternative. ARM litigation (appeal pending) creates CPU architecture uncertainty.
Supply chain risk: Memory shortage (DRAM redirected to HBM for AI data centers) constraining handset production through FY26. Foundry dependency on TSMC and Samsung. Q3 FY26 expected to be bottom for China Android revenue.
Inventory risk: LTM inventory of $7.4B (up from $6.5B at FY25 year end) reflects memory shortage dynamics and Chinese OEM drawdown. If memory shortage persists longer than expected, inventory write down risk increases.
Acquisition and integration risk:35 acquisitions in 5 years. Goodwill of $11.4B (FY25) growing to $14.3B (LTM) with Alphawave. If data center ramp disappoints, goodwill impairment on Alphawave and Modular acquisitions is a real risk. Integration of Arduino, Modular, Edge Impulse, Foundries, and Alphawave teams creates execution complexity.
Legal risk: ARM appealed the December 2024 jury verdict (which Qualcomm won) to the Third Circuit. Qualcomm counter suit trial scheduled October 5, 2026. No accrual recorded, but adverse outcome could affect future ARM architecture licensing terms.
Tax risk: FY25 effective tax rate of 56.2% reflects discrete items. The Q2 FY26 $5.7B tax benefit from CAMT valuation allowance release is non recurring. Future tax rate normalization is uncertain. R&D capitalization rules (under IRC Section 174) continue to affect cash tax timing.
Geopolitical risk: U.S. China technology tensions affect both QCT (export controls on chip sales to Huawei and potentially other Chinese customers) and QTL (Huawei license renegotiation under geopolitical pressure). Taiwan tensions affect TSMC supply continuity.
13.2 Accounting Quality Assessment
One-time items: The $5.7B Q2 FY26 tax benefit is clearly disclosed and excluded from nonGAAP results. The FY18 net loss reflects the Apple dispute and NXP fee, both non recurring. The FY25 56.2% tax rate reflects discrete items. These are transparently disclosed, not hidden.
Share-based compensation: $2.8B in FY25 (6.3% of revenue), growing from $0.9B in FY17 (4.0% of revenue). This is a real economic cost that nonGAAP reconciliation adds back. The growth rate (3x over 9 years) is faster than revenue growth (2x), which is a mild concern, but the absolute level is manageable relative to the $12.8B FCF.
Goodwill and intangibles: Goodwill of $11.4B (23% of total assets) creates impairment risk if acquisitions underperform. The Alphawave and Modular acquisitions are the most at risk if the data center ramp disappoints. No goodwill impairment has been recorded in the 9 year period reviewed.
Non-GAAP adjustments: The non-GAAP reconciliation adds back SBC, acquisition related costs, and one time tax items. This is standard practice for semiconductor companies. The nonGAAP EPS of $9.20 (LTM) is a reasonable representation of underlying earnings power, though investors should subtract the SBC charge ($3.1B LTM) to get a true economic earnings figure.
Off-balance sheet risk: Not disclosed in the provided source set. The 10K would contain commitments and contingencies disclosures. No indication of material off balance sheet exposure in the reviewed documents.
13.3 Future Plans and Management Outlook
Revenue target:$40B non handset QCT revenue by FY29 (raised from $22B at Investor Day 2024). Four year CAGR of 40%. Total revenue aspiration of $100B long term (versus $44.3B FY25).
Data center ramp: Custom silicon shipments begin Q1 FY27. AI accelerator (Dragonfly AI300) launches 2H FY27. Server CPU (Oryon C1000, 5 GHz, 250+ cores) launches 2H FY28. Target: $5B FY27, $15B FY29.
Automotive: Exit FY26 at $6B annualized run rate. Target $10B FY29. $65B design win pipeline. Gen 5 Digital Chassis launching end of FY26 with 3x CPU throughput, 3x GPU capability, 12x NPU performance versus Gen 4.
Robotics: Dragonwing IQ10 platform shipping. Design wins with NEURA (MAiRA robot arm, 4NE1 humanoid) and Figure AI. Over 100 robotics engagements spanning the full stack. targeting $8B industrial/networking/robotics by FY29.
Personal AI: 40+ devices in production or development with 7 of 9 largest cloud companies. Smart glasses launches in 2H 2026 expected to be inflection point. 150 Snapdragon powered PC designs commercializing through 2026.
6G: 60 company coalition launched at MWC. 6G positioned as AI native network with sensing capabilities. Qualcomm positioning as architect and beneficiary of the transition.
Capital allocation: 100% of FCF returned to shareholders. $20B new buyback authorization (March 2026). Low single digit annual dividend growth. OpEx as % of revenue targeted to decline from 23% to 19 to 20%.
Margin targets: QCT EBT margin 30% long term. QTL EBT margin 70% long term. Both achieved in FY25. EPS target greater than $18 by FY29.
14. Geography and Market Share
14.1 Revenue by Geography
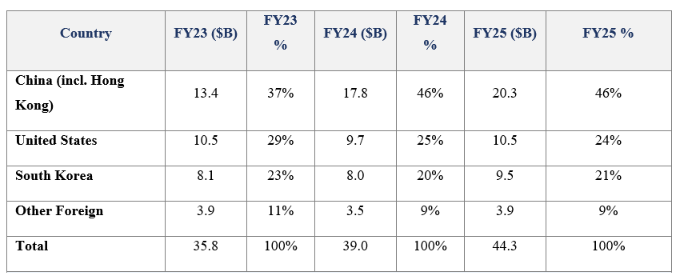
China is the largest geography at 46% of revenue, up from 37% in FY23. This concentration has increased over 3 years, not decreased, despite the geopolitical tensions. The China exposure is the single largest exogenous risk: U.S. export controls, Huawei license renegotiation, and Chinese OEM in sourcing all threaten this revenue base. South Korea (Samsung) is stable at 20 to 23%. U.S. revenue (Apple, plus automotive and IoT customers) has declined as a percentage from 29% to 24% as the China business grew faster.
14.2 Market Share and Positioning
Specific market share figures are not disclosed in the source set. What can be inferred from the transcripts and filings:
Smartphones:Samsung: approximately 70%+ share of premium tier (per Amon on Q1 FY26 call), consistent with prior expectations and stable for next year
Android flagships: Dominant in Google Pixel and most Chinese flagships. ByteDance launched the first agentic AI phone on the Snapdragon 8 Elite. MediaTek is the primary competitor, gaining in the mid-tier.
Automotive:23 consecutive quarters of double-digit YoY growth. $65B design win pipeline. Management claims “there is not a modern vehicle that is built without the Snapdragon Digital Chassis.” On track to be the largest automotive silicon supplier globally.
PC and Personal AI: 40+ personal AI devices in production with 7 of 9 largest cloud companies. 150 Snapdragon PC designs commercializing through 2026. New entrant in the data center with two hyperscaler customers committed.
Sector growth comparison: Not disclosed in primary sources. The semiconductor sector overall is growing mid-single digits to low double digits annually (external estimate, not from source set). Qualcomm QCT revenue grew 16% in FY25, suggesting share gains.
Qualcomm is growing faster than the broader semiconductor sector based on the FY25 QCT growth of 16% versus a sector estimated at mid single digits to low double digits (sector estimate is external and not from the source set). The automotive business is growing at 36% (FY25), dramatically faster than any semiconductor peer. The handset business is growing faster than the handset market (which is relatively flat) due to a premium tier mix shift and content increases. The data center business is not yet at scale, but it is the largest future growth vector.
15. Valuation
15.1 Valuation Approach
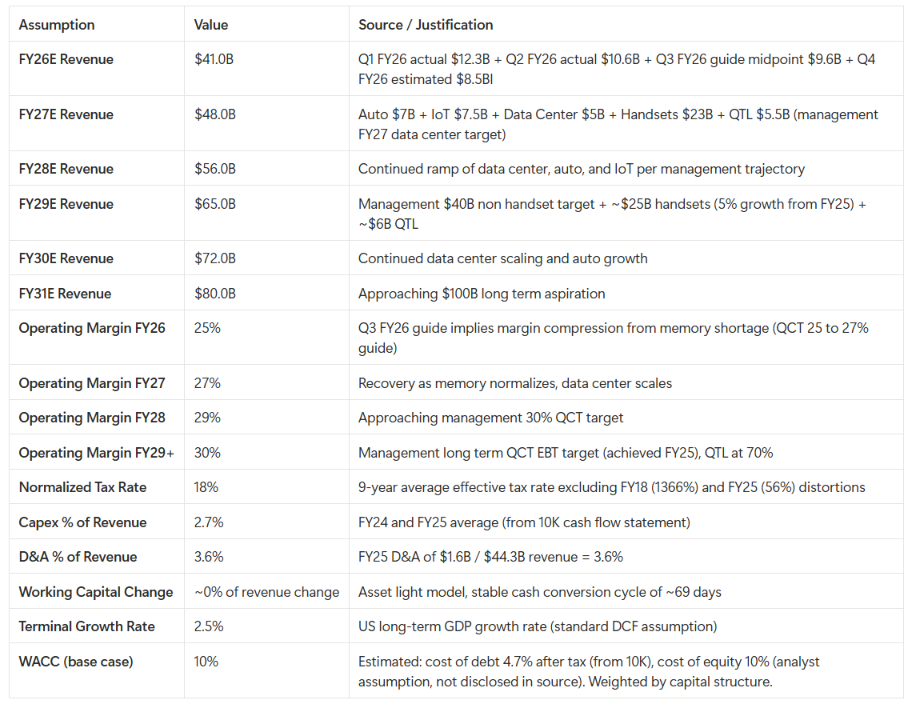
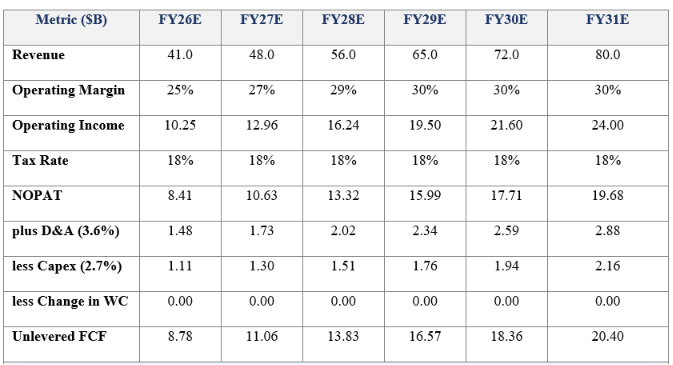
This section performs two valuations: (1) a discounted cash flow (DCF) analysis projecting revenue, margins, and capex strictly based on management guidance and long-term targets, and (2) a relative valuation using historical multiples derived from the provided financial data. The DCF is the primary valuation method because the business model (predictable cash flows, capital light, identifiable growth drivers) supports it. The relative valuation is limited because peer comparison data and current market price are not in the primary source set.
15.2 DCF Assumptions (Strictly Based on Management Guidance)
15.3 DCF Projection: Free Cash Flow Build
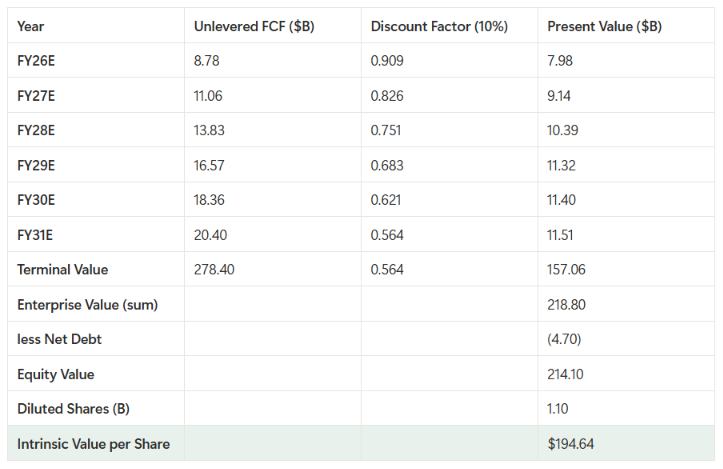
15.4 DCF Valuation: Present Value Calculation
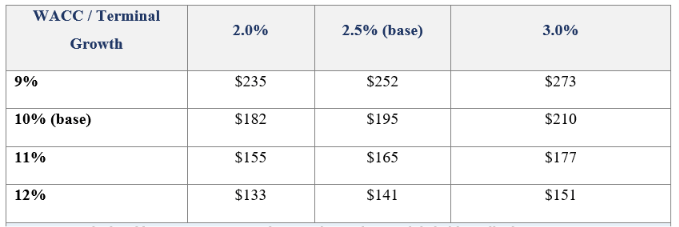
15.5 DCF Sensitivity Analysis
The table below shows intrinsic value per share under different WACC and terminal growth rate combinations:
15.6 Bear Case DCF: Data Center Disappoints
If the data center ramp disappoints (Qualcomm achieves $3B of the $5B FY27 target and $7B of the $15B FY29 target), the revenue and FCF projections change materially:
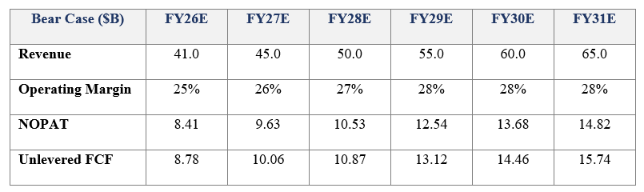
Bear case intrinsic value (10% WACC, 2.5% terminal growth): approximately $135 per share. This is the downside scenario if the data center pivot fails to scale and handsets decline due to Apple and Chinese OEMs in sourcing.
15.9 Valuation Limitations
Three limitations must be noted. First, the WACC cost of equity component (10%) is an analyst assumption, not from the primary source set. The true cost of equity depends on beta, risk-free rate, and equity risk premium, none of which are in the filings. A 1 percentage point change in WACC moves intrinsic value by approximately $20 to $30 per share. Second, the revenue projections depend on management achieving the $40B FY29 non-handset target, which requires the data center ramp to succeed. If the data center ramp is delayed by even one year, the FCF trajectory shifts and intrinsic value declines. Third, the terminal value represents approximately 72% of total enterprise value ($157B of $219B), which is typical for DCF models but means the valuation is highly sensitive to terminal assumptions. A 0.5% change in terminal growth rate moves intrinsic value by approximately $15 per share.
16. Final Verdict
16.1 Classification: Great Business
Qualcomm is classified as a great business, positioned between an elite compounder and a strong business. The classification is based on the following evidence from the primary source set:
Exceptional cash generation: $12.8B free cash flow in FY25, 95% FCF conversion ratio, capital light (3.1% capex to revenue). FCF has grown 3x over 9 years.
Structural moat: QTL patent annuity ($5.6B at 72% margin) provides a perpetual cash flow floor. Modem plus RFFE integration is the deepest technical moat in mobile. Automotive design wins create 5 to 7 year switching cost lock-in.
Proven diversification: Automotive has grown for 23 consecutive quarters at double-digit rates. The $65B design win pipeline is contracted future revenue. IoT is growing 22% YoY. The diversification is no longer a thesis; it is a track record.
Disciplined capital allocation:30% share count reduction over 10 years. 100% of FCF returned to shareholders. $80B cumulative capital return over 9 years. Strategic M&A (35 acquisitions in 5 years), not financial engineering.
High ROIC: Normalized ROIC of approximately 40% in FY25, well above the estimated 9 to 10% cost of capital. The business grows without requiring incremental capital.
The qualification that prevents elite compounder classification is the data center uncertainty. An elite compounder (think Apple, Microsoft, Visa) has proven, durable, multi-decade growth drivers with minimal execution risk. Qualcomm's data center pivot is unproven, with zero track record at scale, and depends on a software stack (Modular) that has not yet achieved market adoption against CUDA. If the data center ramp succeeds at the $15B FY29 target, Qualcomm graduates to elite compounder. If it fails, Qualcomm remains a great business (auto plus QTL plus buybacks) but with a lower growth trajectory.
16.2 Biggest Strength
The QTL royalty annuity is the biggest strength. It generates $5.6B in annual revenue at 72% EBT margin, with minimal capital requirements, and it cannot be disintermediated by any competitor or customer decision. Even if Apple completes modem in sourcing, even if Chinese OEMs develop domestic alternatives, even if MediaTek wins every chip socket, QTL still collects a royalty on every cellular device shipped globally. This is the structural floor that protects the downside and funds the diversification. No other large semiconductor company has a comparable asset.
16.3 Biggest Risk
China is the biggest risk, not Apple and not data center execution. China represented 46% of FY25 revenue ($20.3B). The combination of (1) U.S. export controls that could restrict chip sales to Chinese customers, (2) the expired Huawei license that removes QTL royalties from a major Chinese OEM, (3) Chinese OEMs developing domestic alternatives (SMIC fabricated Kirin, Xiaomi Surge), and (4) the geopolitical tension that could escalate at any time, creates a multi vector risk that is largely outside Qualcomm control. Unlike the Apple risk (which is quantifiable and QTL protected) or the data center risk (which is execution dependent), the China risk is exogenous, unpredictable, and affects both QCT and QTL simultaneously. A 10% reduction in China revenue would reduce total revenue by approximately $2B and FCF by approximately $0.7B after tax.
16.4 Biggest Unknown
The biggest unknown is whether the Modular software stack can achieve meaningful adoption as a CUDA alternative. This is the decisive variable for the data center thesis. If Modular succeeds, Qualcomm silicon advantages (memory architecture, power efficiency, Oryon CPU performance) become commercially relevant, and the $15B FY29 data center target is achievable. If Modular fails to gain developer adoption, Qualcomm data center revenue will be limited to custom ASICs (where the customer provides the software stack), capping the opportunity at perhaps $5 to $7B rather than $15B. The Modular acquisition was announced on June 24, 2026, and the software is not yet commercially deployed at scale. The outcome will not be known for 2 to 3 years.
16.5 What Must Go Right
Near term:Memory shortage bottoms in Q3 FY26 as guided, with sequential handset growth resuming Q4 FY26
Medium term: Apple modem transition does not accelerate beyond current trajectory, QTL royalties hold at 2019 agreement rates through 2027 renewal
Data center: Custom silicon shipments to the unnamed hyperscaler begin Q1 FY27 as scheduled, validating the data center thesis
Software: Modular software stack achieves meaningful adoption as a CUDA alternative by FY28
Automotive: Automotive maintains a double-digit growth trajectory toward the $10B FY29 target
Geopolitics: China's revenue does not deteriorate due to export controls or geopolitical escalation
Capital allocation: Management continues 100% FCF return policy and 3 to 5% annual share count reduction
16.6 What Could Go Wrong
Memory:Memory shortage persists beyond Q3 FY26, extending handset revenue pressure into FY27
Apple: Apple accelerates modem in sourcing or renegotiates QTL royalties at lower rates post 2027
Data center: Data center ramp delayed by 12 to 24 months due to software immaturity or competitive pressure from Nvidia
China: China revenue declines 15 to 20% due to export controls, Huawei non-renewal, or OEM in sourcing
Acquisitions: Goodwill impairment on Alphawave and Modular acquisitions if the data center underperforms
ARM litigation: ARM appeal succeeds, requiring renegotiation of CPU architecture license on unfavourable terms
16.7 Evidence Supporting the Thesis
Automotive track record: 23 consecutive quarters of double-digit automotive growth, $65B pipeline, 8x content uplift Gen 3 to Gen 5
QTL stability: $5.6B revenue at 72% EBT margin, stable through handset cycles, encumbering every cellular device globally
Financial engine:$12.8B FCF, 100% returned to shareholders, 30% share count reduction over 10 years
Recent execution: Q1 FY26 record revenue $12.3B, record EPS $3.50, record QCT $10.6B despite memory headwind
Data center traction: Two hyperscaler customers committed for custom silicon, HUMAIN as accelerator customer, secure wafer and memory capacity
Guidance increase: Raised from $22B to $40B, with $5B FY27 and $15B FY29 data center targets
16.8 Evidence Weakening the Thesis
China concentration: 46% of revenue from China, Huawei license expired, export controls active
Apple: In sourcing its own modem, QCT revenue step down begins September 2026
Customer concentration:46% of Q2 FY26 revenue from top two customers, each a strategic risk vector
Data center unproven: Zero track record shipping data center silicon at scale, Modular unproven against CUDA
Goodwill: $11.4B goodwill (23% of assets) at risk if acquisitions underperform
Memory shortage: Memory shortage constraining handset production through FY26, Q3 FY26 expected bottom
16.9 What Would Change My Mind
Three developments would cause a re-evaluation of the thesis. First, if the Q1 FY27 custom silicon shipments to the unnamed hyperscaler are delayed or cancelled, the data center thesis loses its primary validation point, and the stock should be revalued at the bear case DCF ($135 per share). Second, if China's revenue declines more than 15% in a single year due to export controls or geopolitical escalation, the QTL floor is threatened, and the entire cash flow model needs revision. Third, if the Huawei license is not renewed on commercially reasonable terms by the end of FY26, QTL revenue could face a structural step down, removing the floor that protects the downside. Conversely, if the data center ramp exceeds the $5B FY27 target (say, $7B), the bull case DCF ($210 to $273) becomes the base case, and the stock re-rates meaningfully higher.
17. Scores and Thesis Check
17.1 Scoring Framework (1 to 5 per metric)
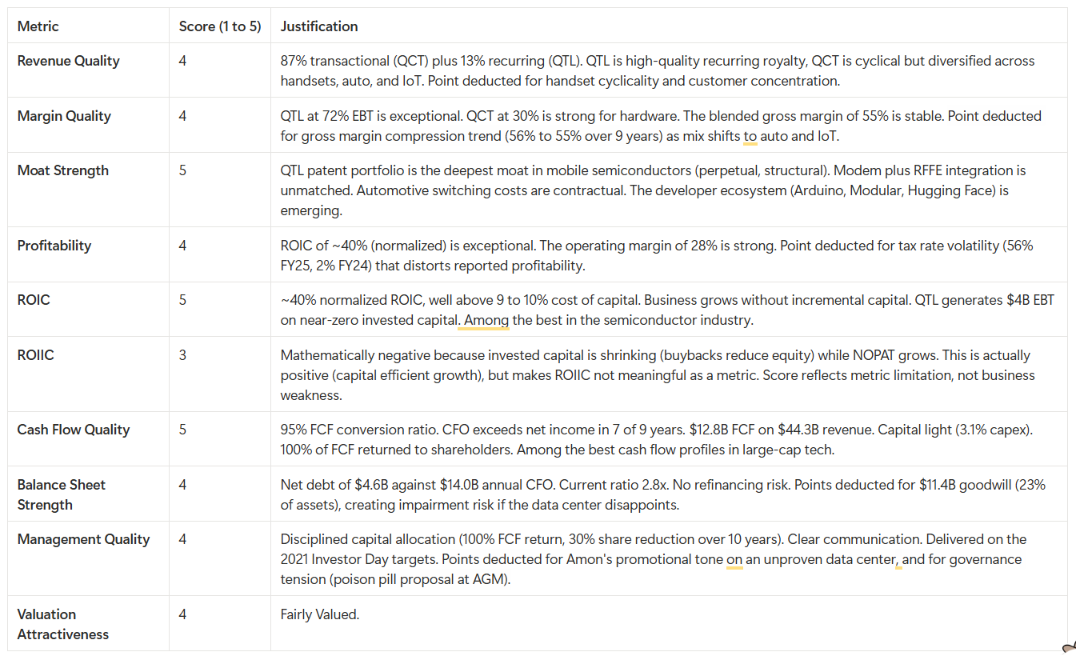
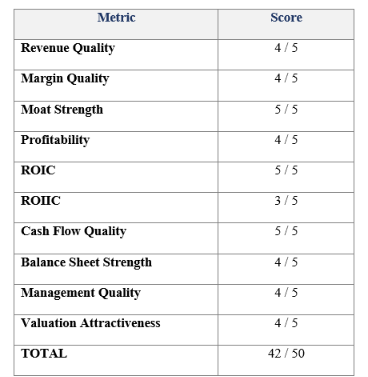
A score of 42 out of 50 (84%) places Qualcomm in the upper tier of businesses evaluated on this framework. The scores reflect a business with an exceptional moat, exceptional cash generation, and exceptional capital efficiency, with moderate deductions for customer concentration, tax rate volatility, and dependence on an unproven data center ramp.
17.3 Thesis Check Summary
Biggest strength: The QTL royalty annuity ($5.6B at 72% margin) is a structural cash flow floor that cannot be disintermediated by any competitor or customer decision. It funds the diversification and protects the downside.
Biggest risk: China revenue concentration (46% of FY25) combined with active U.S. export controls, expired Huawei license, and Chinese OEM in sourcing, creates a multi-vector exogenous risk affecting both QCT and QTL simultaneously.
Biggest unknown: Whether the Modular software stack can achieve meaningful adoption as a CUDA alternative. This is the decisive variable for the $15B FY29 data center target. The outcome will not be known for 2 to 3 years.
17.4 Final Verdict
Great business. Qualcomm is a great business with a structural cash flow floor (QTL), a proven automotive growth engine ($6B run rate, $65B pipeline), and a high upside data center option ($5B FY27, $15B FY29) that is not currently priced into the stock. The base case (auto plus QTL plus buybacks) justifies ownership on its own merits at the inferred market price of approximately $192, with DCF intrinsic value of $195 in the base case and $135 in the bear case.
The business is not an elite compounder yet because the data center pivot is unproven. If the $15B FY29 data center target is achieved, Qualcomm graduates to elite compounder status and the stock re-rates meaningfully higher. If it fails, Qualcomm remains a great business with a lower growth trajectory but still supported by the QTL floor and the automotive track record. The patient long-term investor is paid to wait through the 100% FCF return policy and the 3 to 5% annual share count reduction, while the data center option plays out over the next 2 to 3 years. The catalyst that closes the valuation gap is the verification of first custom silicon shipments to a hyperscaler in Q1 FY27. Until then, the market can reasonably discount the data center thesis as unproven, and the smartphone company persists.
18. References
All financial figures, management commentary, and forward-looking statements in this report are sourced from the primary documents. No outside data sources (news articles, sell-side estimates, third-party market research, or external databases) are used. Where a number is not in the source set, the report states **not disclosed**.
19. Disclaimer
This report is prepared for internal research and educational purposes only and does not constitute investment advice, a recommendation to buy or sell any security, or a solicitation of any kind. All financial data and management commentary are sourced from Qualcomm Incorporated's official SEC filings, Investor Day presentations, earnings call transcripts, AGM transcripts, and official product specification pages. No outside data sources are used. Forward-looking statements attributed to Qualcomm management reflect Qualcomm's own disclosures and are subject to risks and uncertainties. The DCF valuation uses management guidance for revenue and margin projections, with the cost of equity component of WACC being an analyst assumption (not disclosed in primary sources). Readers should perform their own due diligence and consult the original filings before making investment decisions.
Thanks for the great research! Really nice read. I'll keep an eye on QCOM progress implementing their strategy.
QCOM for the win